Seafood operations
Where did the margin go?
Seafood margin analysis with a reproducible Norwegian salmon price study, plus checks for lot costs, yield, freight allocation and credits.


The takeaway
Keep the market comparison separate from the shipment calculation. A useful margin report preserves the sales-line totals, assigns every cost once and shows which records were available at the review cutoff.
Take the 52 weekly export prices in Statistics Norway’s 2025 fresh or chilled farmed salmon series. Their simple average is NOK 81.79/kg. Weight those prices by the tonnes exported each week and the result is approximately NOK 79.81/kg. The underlying observations are unchanged; the averaging method answers a different question. That is a useful place to start before working through the more detailed records behind a shipment margin.
1. Start with a price series you can reproduce
The analysis uses every published week from 2025U01 to 2025U52 in SSB table 03024, commodity 01. Prices range from NOK 60.58/kg in week 31 to NOK 125.36/kg in week 1. The weekly volumes total 1,101,187 tonnes. These are statistical weeks labelled 2025, whose boundaries need not match the calendar year exactly.
For a period price comparison, the weighted calculation is the sum of weekly price multiplied by weekly tonnes, divided by total tonnes. A simple mean instead describes the average weekly observation. Because SSB publishes rounded prices and tonnes, our weighted result is approximate. It is not an official annual unit value from SSB.
SSB defines price as the average per kilo per week and volume as net mass in tonnes. Its export values are measured at the Norwegian border on an FOB basis. The series covers selected fresh or chilled farmed salmon commodity codes and a mix of exports. It does not identify an operator’s grade mix, purchase costs, freight bills or customer credits. Use it as market context, then reconcile the transaction records needed for your own margin.
Dashed line: approximate volume-weighted mean from rounded weekly prices and tonnes. All 52 published 2025 weeks are included. This national series does not contain shipment costs or margins.
Data, calculation and downloads
Weight each weekly price by that week’s export tonnage, then divide by total tonnage: Σ(price × tonnes) ÷ Σ(tonnes). The weekly tonnage total is 1,101,187 tonnes.
Source: Statistics Norway, table 03024, commodity 01. Weeks 2025U01 to 2025U52. Retrieved 2026-11-06. Prices are in NOK/kg; volume is net mass in tonnes. The dataset uses the selected salmon commodity codes described in SSB’s methodology. It is not a grade- or customer-matched transaction series.
Norami calculations. SSB data reused under CC BY 4.0. The derived mean is approximate because the source prices and weights are rounded.
Extract the ZIP and run python3 reproduce.py. Python 3.10+; no extra packages. The saved snapshot runs offline. Use python3 reproduce.py --fetch-check to compare it with the live SSB response.
Reference: SSB table 03024 · SSB definitions and coverage
2. Define the cost boundary before the margin
For this review, shipment contribution is net sales after customer credits, less the product cost assigned to the shipment and the additional shipment costs in scope. Write down those cost categories. A sales-minus-purchase-price spread, a shipment contribution and financial-statement gross margin measure different things.
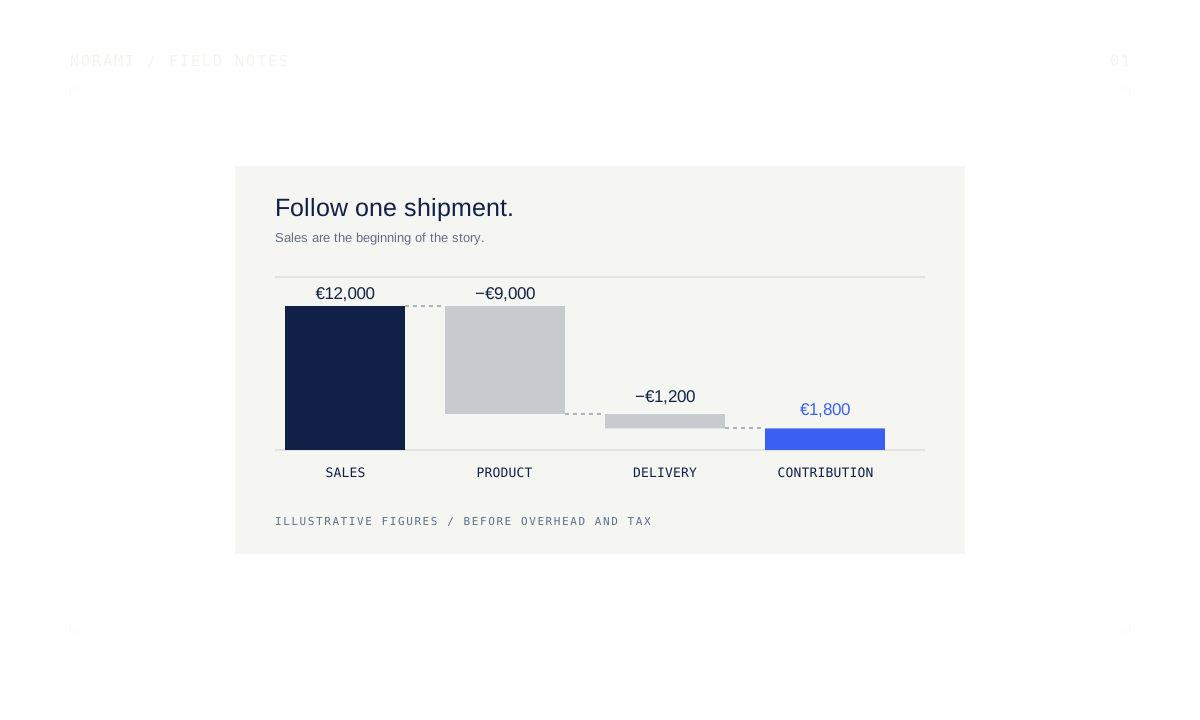
The separate worked shipment is illustrative: €12,000 in sales, €9,000 in assigned product cost and €1,200 in outbound freight and handling. All amounts are in EUR. There is no assumed relationship to the Norwegian export series, and no separate processing cost, currency movement, tax or overhead allocation in this example.
Check the inventory cost field before adding further charges. In a production business, it may already contain direct labour, production overhead or inbound freight. IAS 2 includes purchase and conversion costs in inventory cost. Adding a category already included would count it twice. Reconcile the operating view to the inventory and general ledgers; the physical lot history alone does not determine the accounting cost formula.
Reference: IFRS Foundation: IAS 2 cost scope
3. Set the row grain and preserve lot lineage
Decide what one row in the margin report represents. One sales delivery line, for one product specification and shipment, is a useful starting point. Keep its legal entity, customer, currency and unit of measure. When the line uses several lots, a separate allocation table should link it to each lot’s quantities and costs. The full sales amount belongs to the delivery line once.
Consider a €12,000 sales line linked to two lots and three freight lines. Joining both detail tables directly can create six rows, each repeating the sales amount. The result can look plausible until someone checks the total. Aggregate each cost stream to the delivery line, or use allocation weights, before joining it to revenue. Compare totals before and after the join.
Processing adds another relationship to preserve: input lots, the production event and output lots. GS1’s seafood guideline describes processing events with input and output product identifiers, lot identifiers, quantities, time and location. That records the product’s history. Your costing policy still determines how the euros are assigned.
Keep one sales value at the delivery-line grain. If two lots fulfil that line, allocate quantity and cost through a separate mapping; do not repeat the €12,000 revenue on both lot rows.
- Retain source-system and document-line identifiers, not just invoice numbers.
- Represent partial deliveries and lot splits explicitly; reconcile allocated quantities to the original line.
- Keep reversals and credit notes linked to their original transaction.
- Leave unmatched costs in an exception register with an amount, reason and owner.
See how Norami traces an answer back to its sources.
Reference: GS1 seafood traceability guideline, §4.3.4 (v1.3)
4. Reconcile weight bases and processing yield
A kilogram of whole-round fish and a kilogram of finished fillet are different cost bases. Record species, product form, size grade, trim specification, fresh or frozen state, and the stage at which the weight was measured. Mark estimates as estimates. For frozen product, record the glaze basis; for packed product, separate product weight from packaging and tare.
Main-product yield is main-product output kg divided by input kg for a defined production boundary. The mass balance also needs co-products, recorded losses and work in progress. Include added water or ingredients among the inputs where relevant. Investigate the unexplained residual instead of assigning it to process loss by default.
For a separate yield calculation, suppose 1,000 input kg cost €9,000 and produce 800 kg of a specified main product. Assigning all raw-material cost to that product gives €11.25 per output kg. At 760 output kg, the same input cost becomes €11.84 per output kg. These calculations exclude conversion costs and any raw-material cost assigned to co-products.
The assumed 80% and 76% yields are arithmetic examples, not species targets. FAO’s historical review describes substantial variation in yield measurements and problems with inconsistent product definitions. Establish a baseline from measured production with comparable species, specifications and processes.
| Measure | Calculation or basis | Interpretation |
|---|---|---|
| Main-product yield | Main-product output kg ÷ matched input kg | Requires a defined input form and output specification |
| Raw-material cost per output kg | Raw-material cost assigned to main product ÷ its output kg | Exclude co-product allocations; identify conversion costs separately |
| Mass-balance residual | Opening WIP + inputs − main/co-product outputs − recorded losses − closing WIP | Unexplained quantity; investigate on a consistent physical basis |
| Shipment contribution per kg | Shipment contribution ÷ invoiced net product kg | Comparable only when product and weight bases match |
Reference: FAO: yield definitions and variability
5. Allocate freight once, using a defensible driver
Assign direct charges to their shipments first. For a shared invoice, retain its amount, the shipments it covers and the allocation driver. The driver should reflect the charge: chargeable weight for a weight-rated movement, pallet positions for a pallet-rated movement, or another documented basis that fits the service.
A €3,000 freight bill covering 20 equivalent pallet positions assigns €1,200 to a shipment using eight positions: €3,000 × 8 ÷ 20. Allocate the remaining €1,800 to the other eligible shipments. The assigned amounts must reconcile to the bill, with any rounding adjustment recorded. Assign shipment-specific surcharges directly before splitting the shared balance.
Separate inbound freight already included in inventory cost from outbound distribution charges added in the report. Keep storage, handling, inspection and rework in their own categories when they are in scope. The agreed commercial terms determine which charges belong to your business.
Keep estimates and invoices distinguishable. If the report contains a €1,400 freight estimate and the final invoice is €1,200, replace or reverse the estimate in the analytical view. Contribution improves by €200. Counting both charges would overstate cost. Finance should determine the accounting entries and period treatment.
6. Separate shipment economics from posting cutoff
Store shipment date, document date, posting date and report cutoff separately. The latest shipment review uses information available at its stated cutoff. A period report follows the applicable recognition rules. A credit’s posting date alone does not settle its accounting period: IFRS 15’s variable-consideration requirements can call for an estimate before a credit note is issued.
The illustrative shipment starts with €1,800 contribution: €12,000 sales less €9,000 product cost and €1,200 delivery. A later €300 price credit reduces net sales to €11,700 and contribution to €1,500. This assumes the credit was not already estimated or provided for, pays for no distinct service and involves no physical return. A return needs its own quantity, inventory and cost reconciliation.
Contribution has fallen by 16.7% relative to the original €1,800. The contribution rate has moved from 15.0% to approximately 12.8%, a decline of about 2.2 percentage points. Calculate the revised rate as €1,500 divided by €11,700. Using the original sales amount would give a different denominator from the revised margin calculation.
The controls vary the price credit and additional delivery cost while keeping product quantity, product cost and currency fixed. They do not model returns, yield changes or accounting-period recognition.
€12,000 net sales − €9,000 product − €1,200 delivery = €1,800 contribution.
Illustrative distribution shipment, before overhead and tax. Quantity and product cost stay fixed; the credit is price-only, with no prior provision, distinct service or physical return. Contribution rate = contribution ÷ net sales. A negative result means the included costs exceed net sales.
| Component | Original review | After credit |
|---|---|---|
| Net sales | €12,000 | €11,700 |
| Assigned product cost | €9,000 | €9,000 |
| Outbound freight and handling | €1,200 | €1,200 |
| Shipment contribution | €1,800 | €1,500 |
| Contribution ÷ net sales | 15.0% | 12.8% (rounded) |
Reference: IFRS Foundation: IFRS 15 revenue recognition
7. Make the result reproducible before scaling it
Keep the source extract, allocation rules and review cutoff with the result. Monetary records need the original currency, reporting currency, exchange rate and rate date. When comparing periods, identify the rate effect before attributing the whole movement to price or yield.
Reconcile the operating view to ledger totals for a defined scope and period. Record timing differences, unallocated costs and excluded categories in a reconciliation schedule. Set weight and rounding tolerances from the measurement precision and currency rules. A tolerance should not hide an unexplained difference.
The acceptance checks below give the first implementation a testable scope. If a check fails, keep the affected amount and an owner visible alongside the provisional margin. Start with a shipment that reconciles and an exception case before comparing whole customer or supplier portfolios.
- Start with one reconciled shipment and one exception case.
- Review the definitions with commercial, operations and finance owners.
- Only compare suppliers or customers after product, weight and cost scope are aligned.
| Control | What must reconcile |
|---|---|
| Join integrity | Sales-line totals are unchanged after adding lot and cost detail. |
| Quantity conservation | Lot allocations sum to the source quantity; processing residuals are explained. |
| Cost allocation | Assigned charges plus explicitly unallocated charges equal each source bill. |
| Estimate replacement | The same charge is not included as both an estimate and an actual invoice. |
| Credit treatment | A price-only credit reduces sales and contribution once; returns follow a separate quantity workflow. |
| Cutoff and currency | Every amount has a source date, currency basis and declared review cutoff. |
Use Norami to work through your shipment data
Norami lets your team ask questions across spreadsheets, ERP exports and connected databases in plain language, then inspect the sources and query behind the answer. For a shipment review, that means working across the sales, lot and cost records described in this guide.
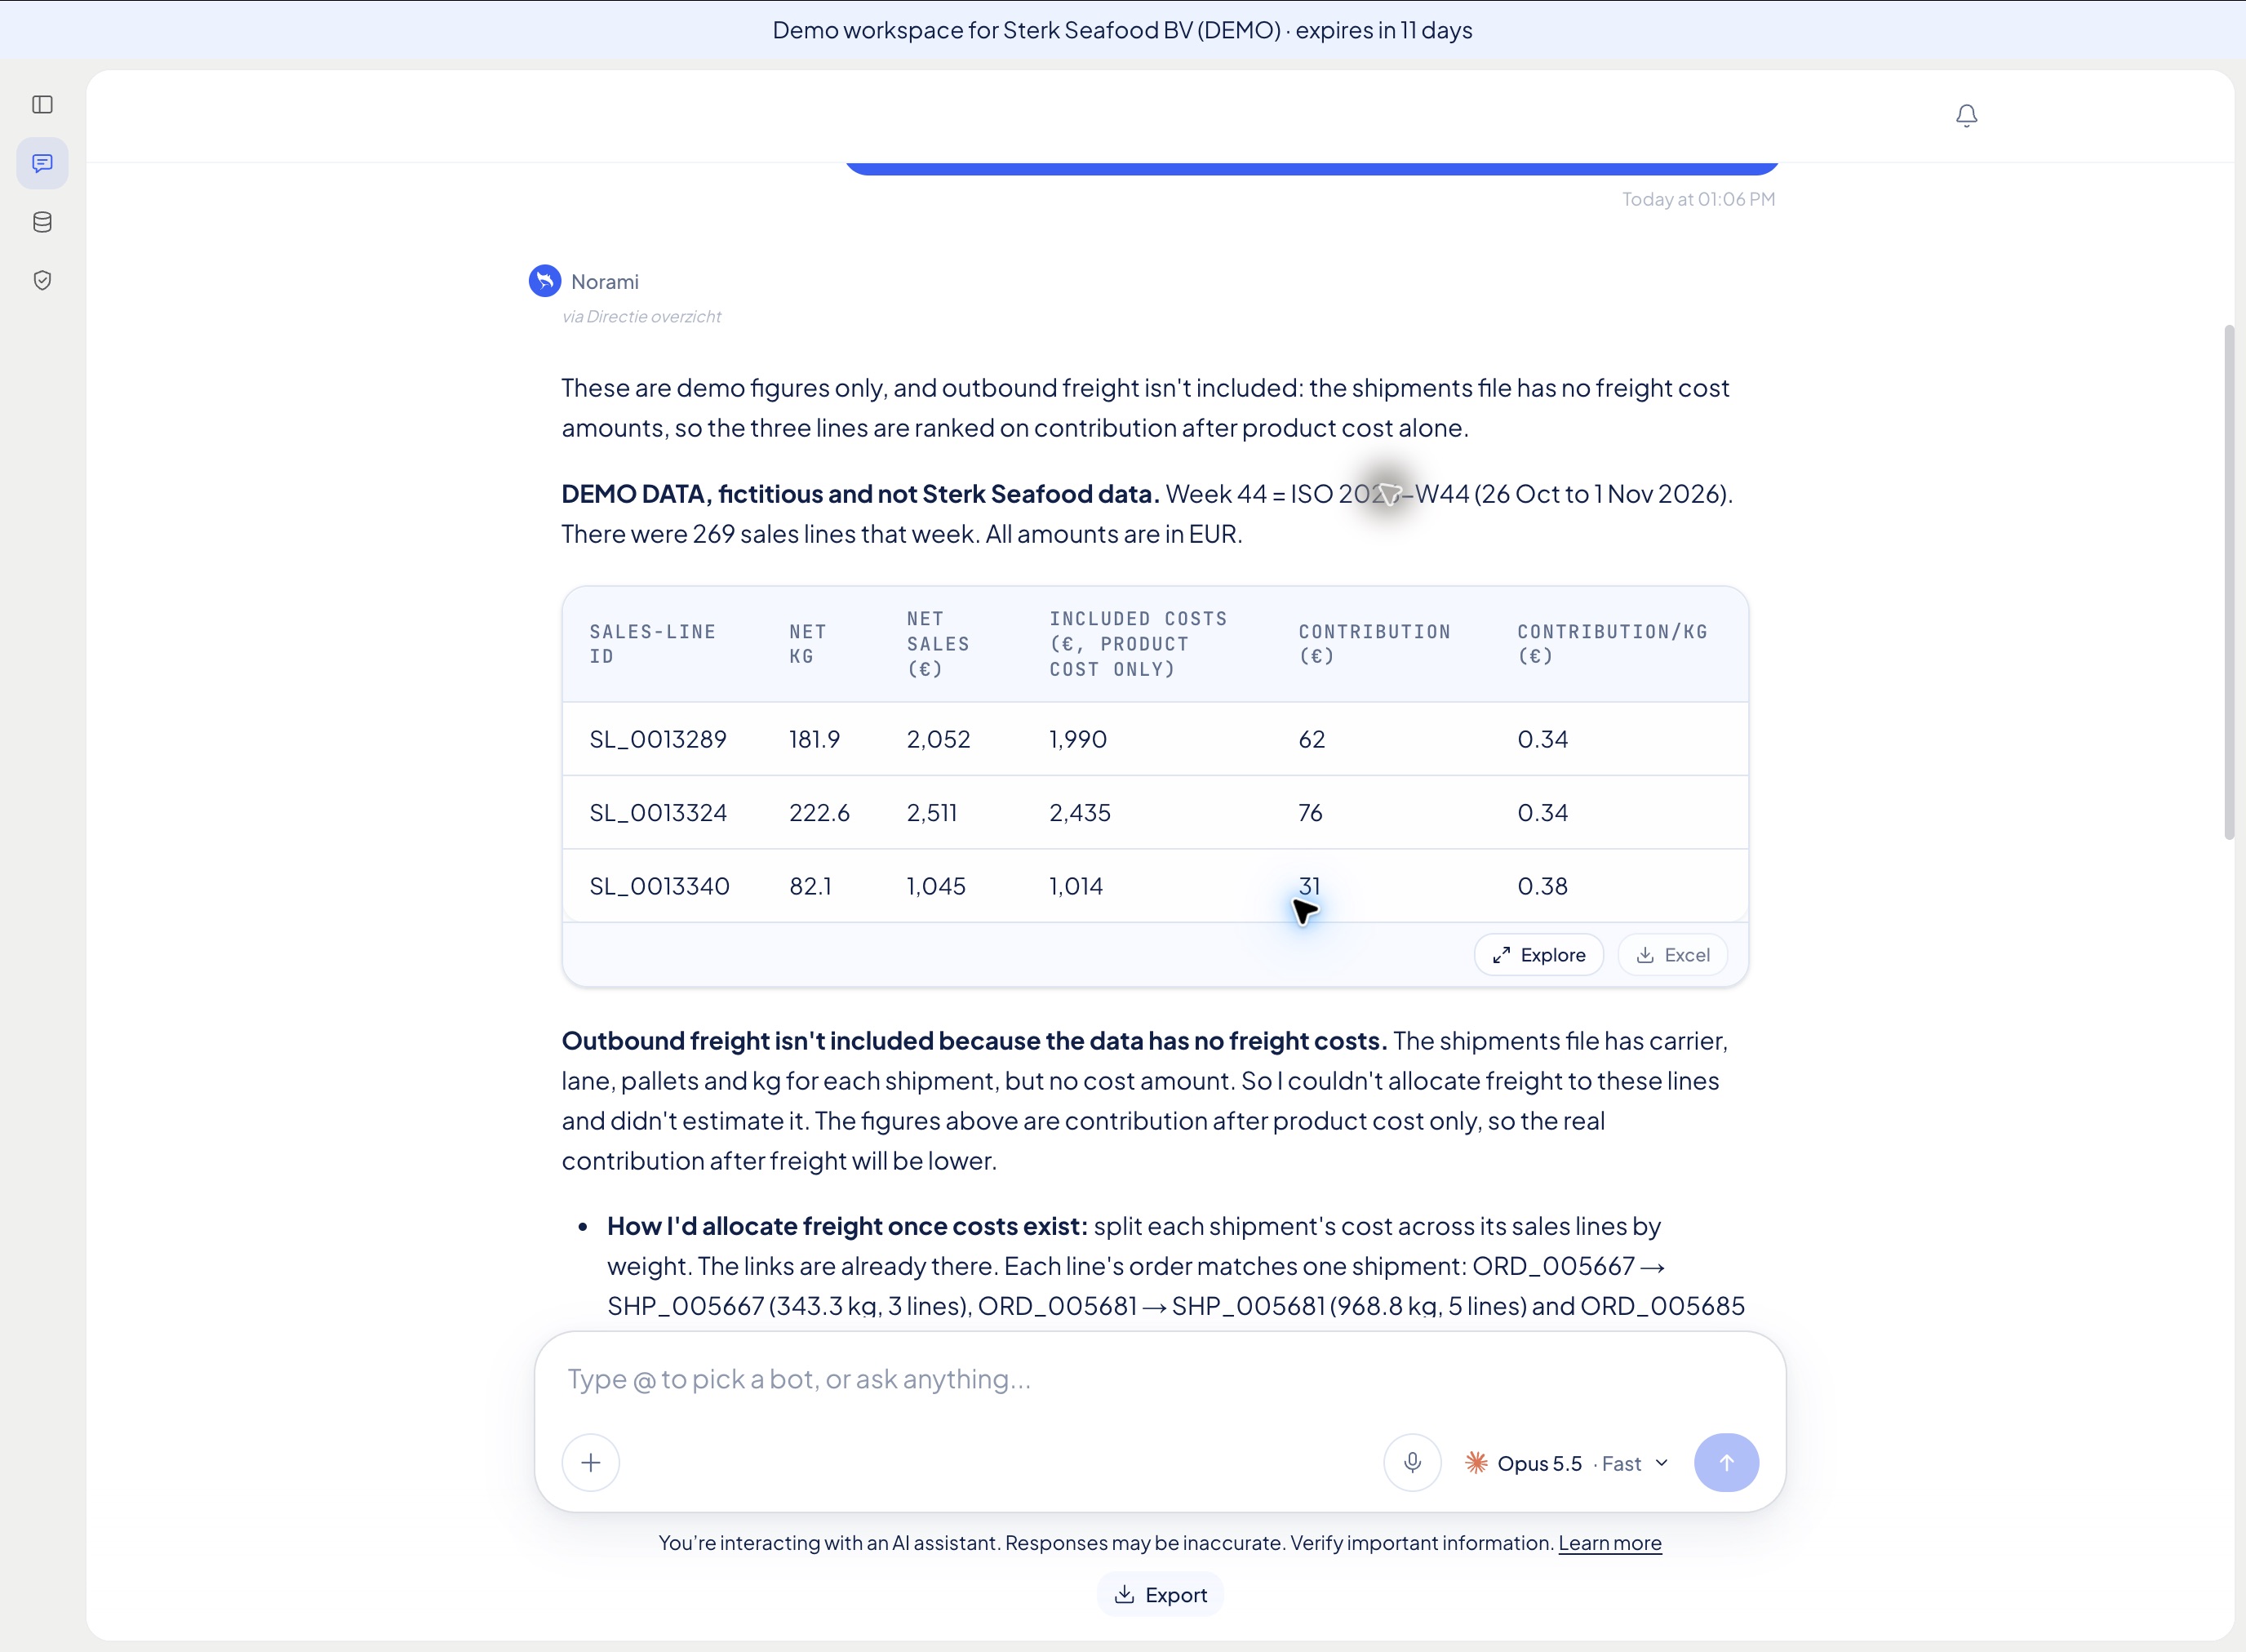
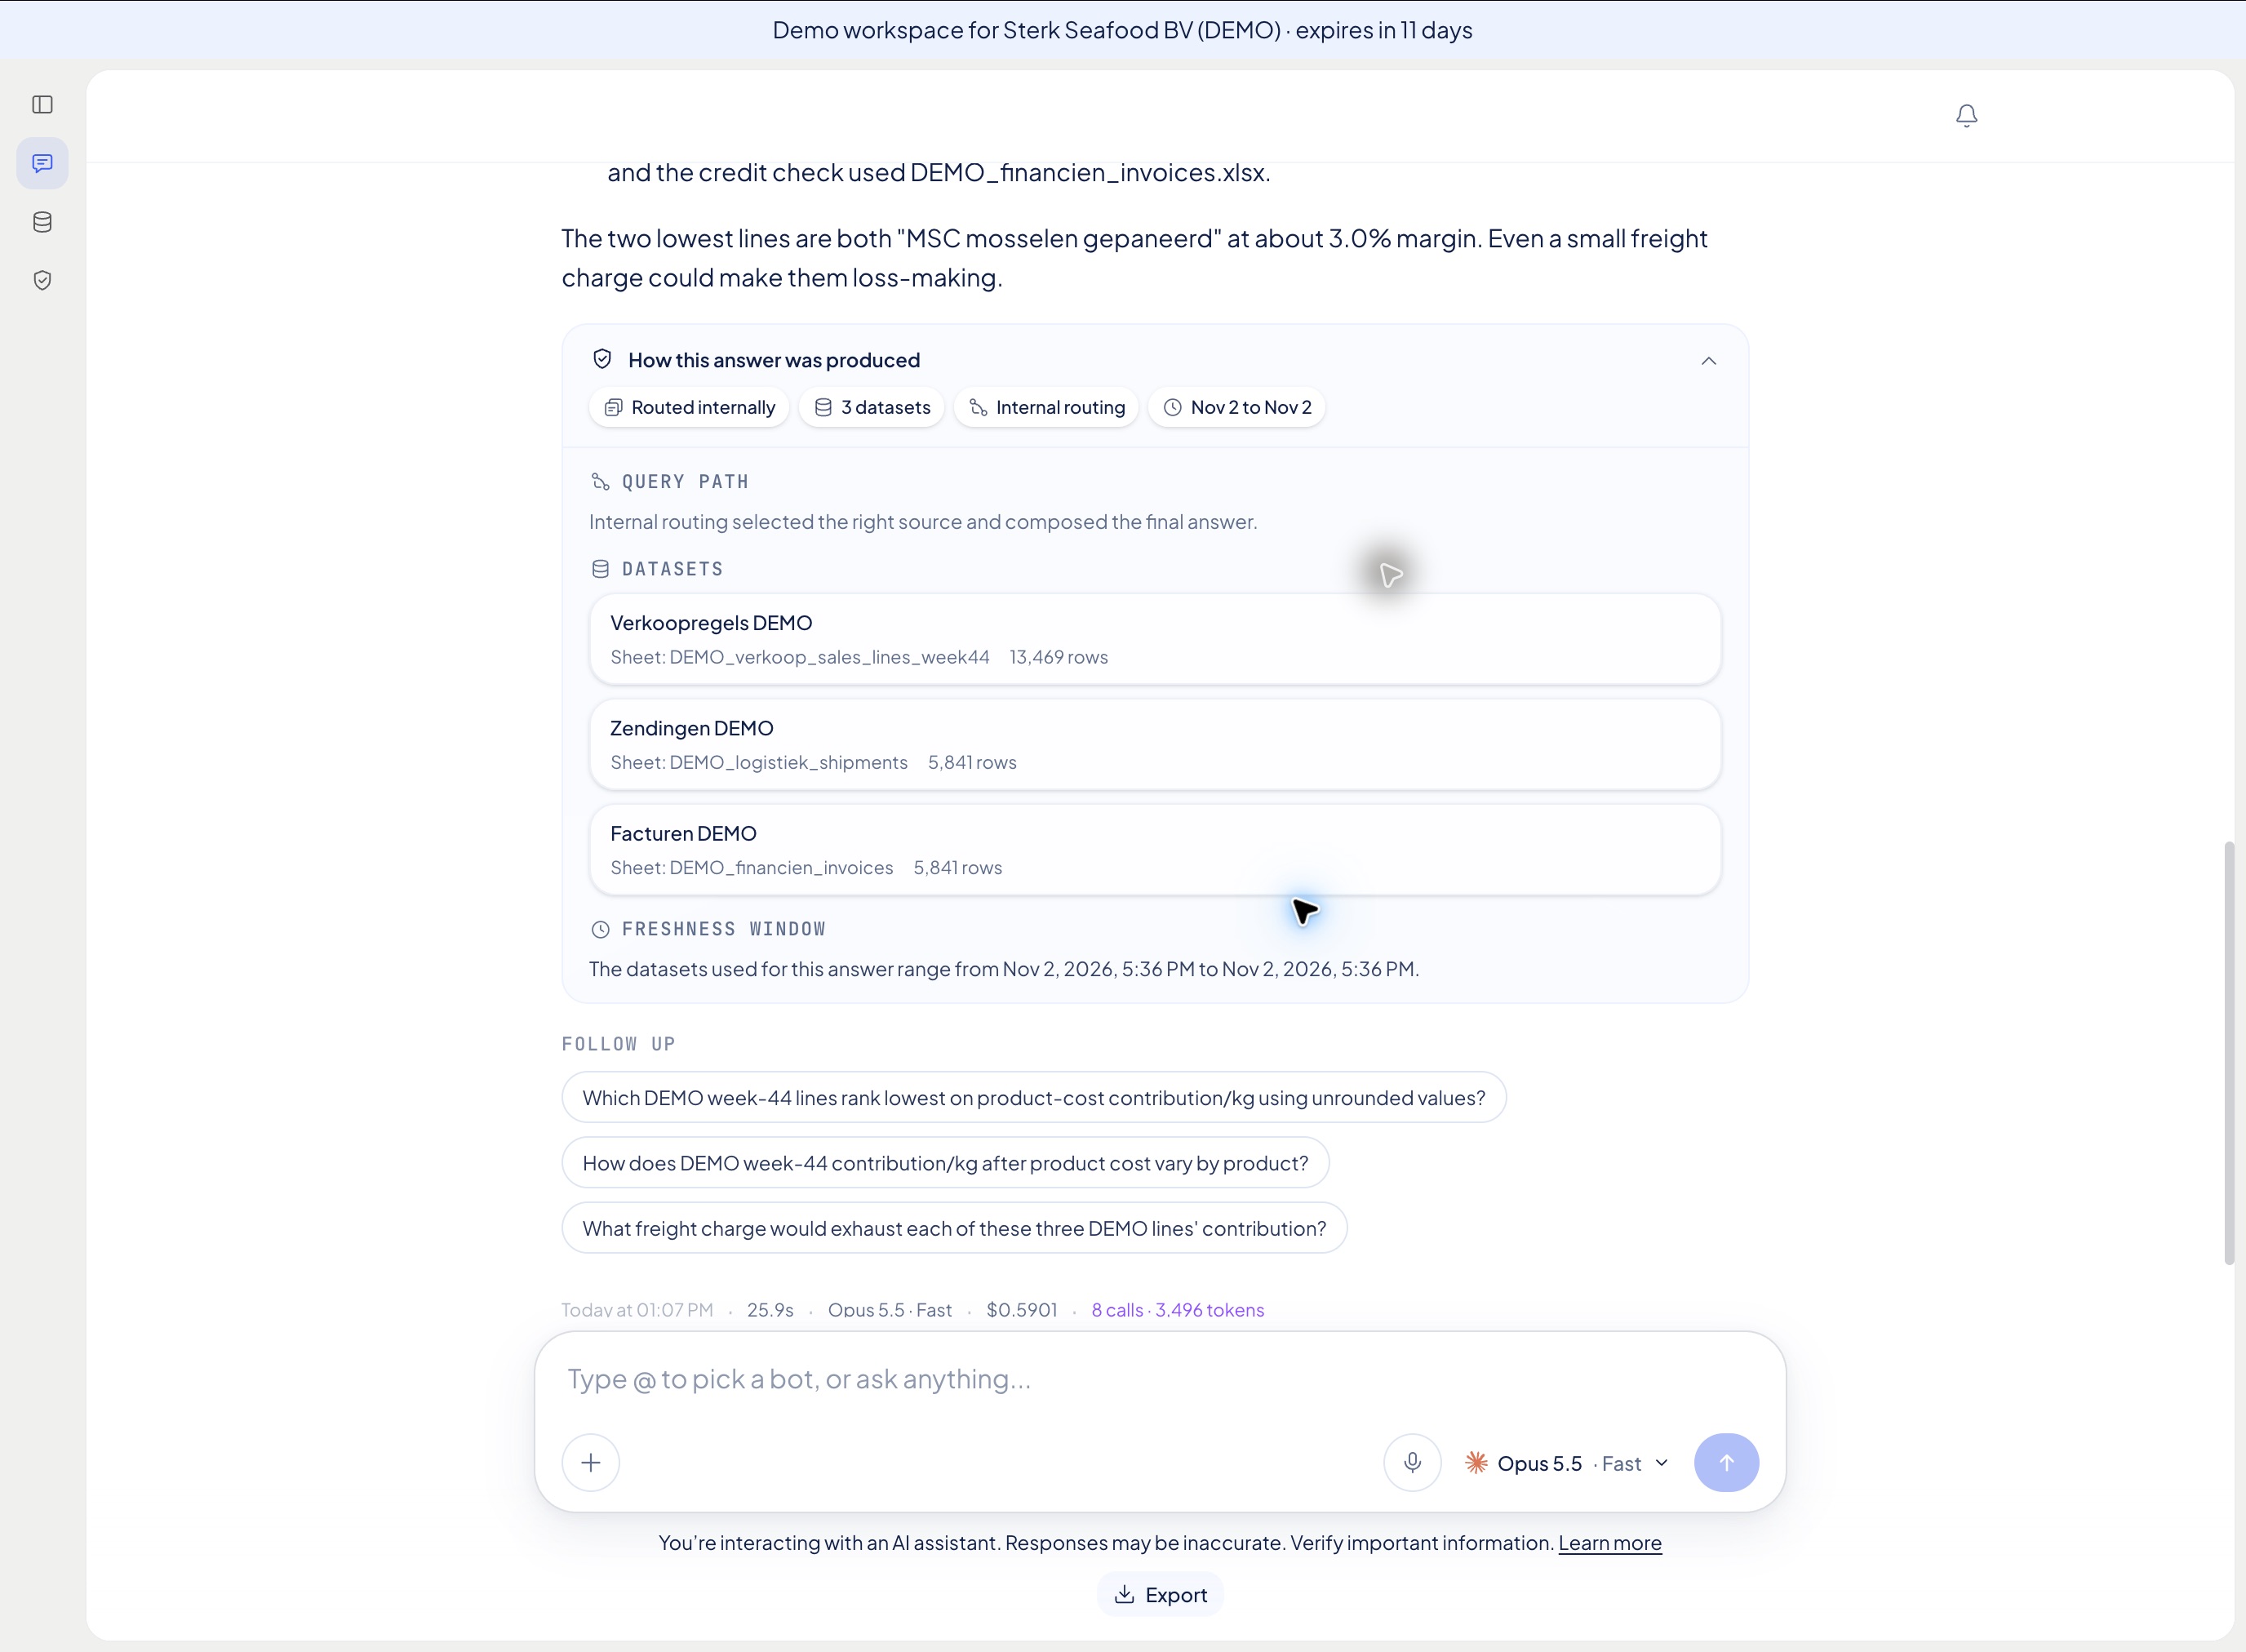
In the live demo below, we asked which week-44 sales lines had the lowest contribution per kilo after product cost and outbound freight. Norami returned a table and flagged a missing input: the demo shipment file contained no freight charges. The answer therefore shows contribution after product cost only. The expanded evidence panel identifies the sales, shipment and invoice datasets used.
Bring one shipment-margin question to a demo. We can walk through the records it needs and show how to inspect the answer in Norami.
Inside Norami · Actual product captures · Demo data
The answer, with its cost boundary
Open the evidence behind the answer
Sources and scope
- Statistics Norway: table 03024 and salmon export methodology: Source of the 52 public weekly observations. Norami’s weighted mean uses rounded source prices and tonnes; the shipment example is separate and illustrative.
- GS1 seafood traceability guideline, §4.3.4 (v1.3): Processing-event and lot-lineage reference. It does not prescribe the margin or cost-allocation method used here.
- FAO: yield definitions and variability: Background on yield definitions and variability. No species yield benchmark is taken from these tables for the example.
- IFRS Foundation: IAS 2 cost scope: Inventory cost scope, including conversion costs. The worked shipment contribution is a deliberately scoped operating measure, not a complete IAS 2 valuation.
- IFRS Foundation: IFRS 15 revenue recognition: Transaction-price estimation and revenue recognition. A later credit note does not by itself establish the appropriate accounting period; the interactive example only recalculates shipment contribution.
Put it into practice
Explore Norami for seafood distribution